The Insert tab in Microsoft Excel is your go-to place for adding charts, pictures, tables, shapes, and other objects to make your spreadsheets more visual and interactive. Organized into handy groups like Tables, Illustrations, Charts, and Links, it helps you quickly build professional-looking worksheets without searching through menus. In this blog, you’ll learn easy ways to use each Insert tab group to enhance your data presentations and create stunning Excel files.
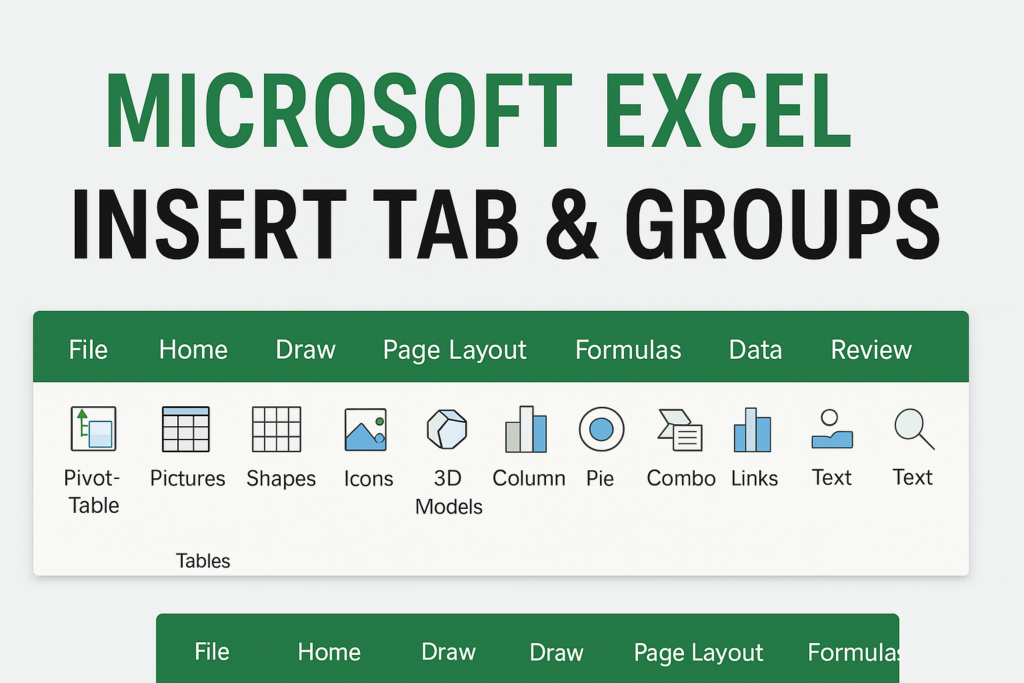
All Groups Under the Insert Tab in Excel
The Insert Tab includes the following groups:
1. Tables Group
This group allows you to organize and analyze data efficiently.
Features:
- PivotTable – Summarize large datasets easily
- Table – Convert data ranges into Excel tables with filters
- Recommended PivotTables – Auto-suggested layouts based on data
Use Case:
Use this when you need structured data, automatic formatting, and filter/sort controls.
2. Illustrations Group
Used to insert visual elements.
Features:
- Pictures – Add images from your device or online
- Shapes – Insert circles, rectangles, arrows, etc.
- Icons – Insert vector icons
- 3D Models – Add 3D graphics
- SmartArt – Create flowcharts or diagrams
- Screenshot – Take screen clippings and paste directly
Use Case:
Helpful for presentations, flow diagrams, or improving visual design.
3. Add-ins Group
Helps increase functionality using extensions.
Features:
- Get Add-ins – Install Office add-ins
- My Add-ins – Access previously installed add-ins
Use Case:
Best for automating tasks or adding third-party functionality.
4. Charts Group
The most important group for data visualization.
Features:
- Column, Line, Pie, Bar, Area, Scatter
- Recommended Charts – Excel suggests suitable chart types
- Combo Chart – Mix chart types like bar + line
Use Case:
Used when representing data visually for analysis or presentations.
5. Sparklines Group
Small charts inside a single cell.
Features:
- Line Sparkline
- Column Sparkline
- Win/Loss Sparkline
Use Case:
Quickly show trends alongside data tables.
6. Filters Group
This allows you to apply advanced filtering features.
Features:
- Slicer – Create clickable filters for tables
- Timeline – Filter PivotTables by dates
Use Case:
Useful in dashboards and interactive reports.
7. Links Group
Insert interactive links inside Excel.
Features:
- Link – Add hyperlinks to webpages, files, or worksheet locations
Use Case:
Ideal for navigation or linking external resources.
8. Text Group
Insert text objects.
Features:
- Text Box – Add movable text
- Header & Footer – Insert page numbers, dates, file paths
- WordArt – Decorative text styles
- Signature Line – Add digital signature
- Object – Insert Word, PDF, or embedded objects
Use Case:
Great for formatting worksheets, documents, and printable sheets.
9. Symbols Group
Insert symbols or mathematics-related characters.
Features:
- Equation – Add mathematical formulas
- Symbol – Insert special characters
Use Case:
Useful for academic and technical documents.
Final Thoughts
The Insert Tab in Microsoft Excel is a powerful toolkit that transforms simple worksheets into interactive and visually rich dashboards, reports, and presentations. Whether you are working with data tables, visuals, or diagrams, mastering this tab can significantly boost your productivity.