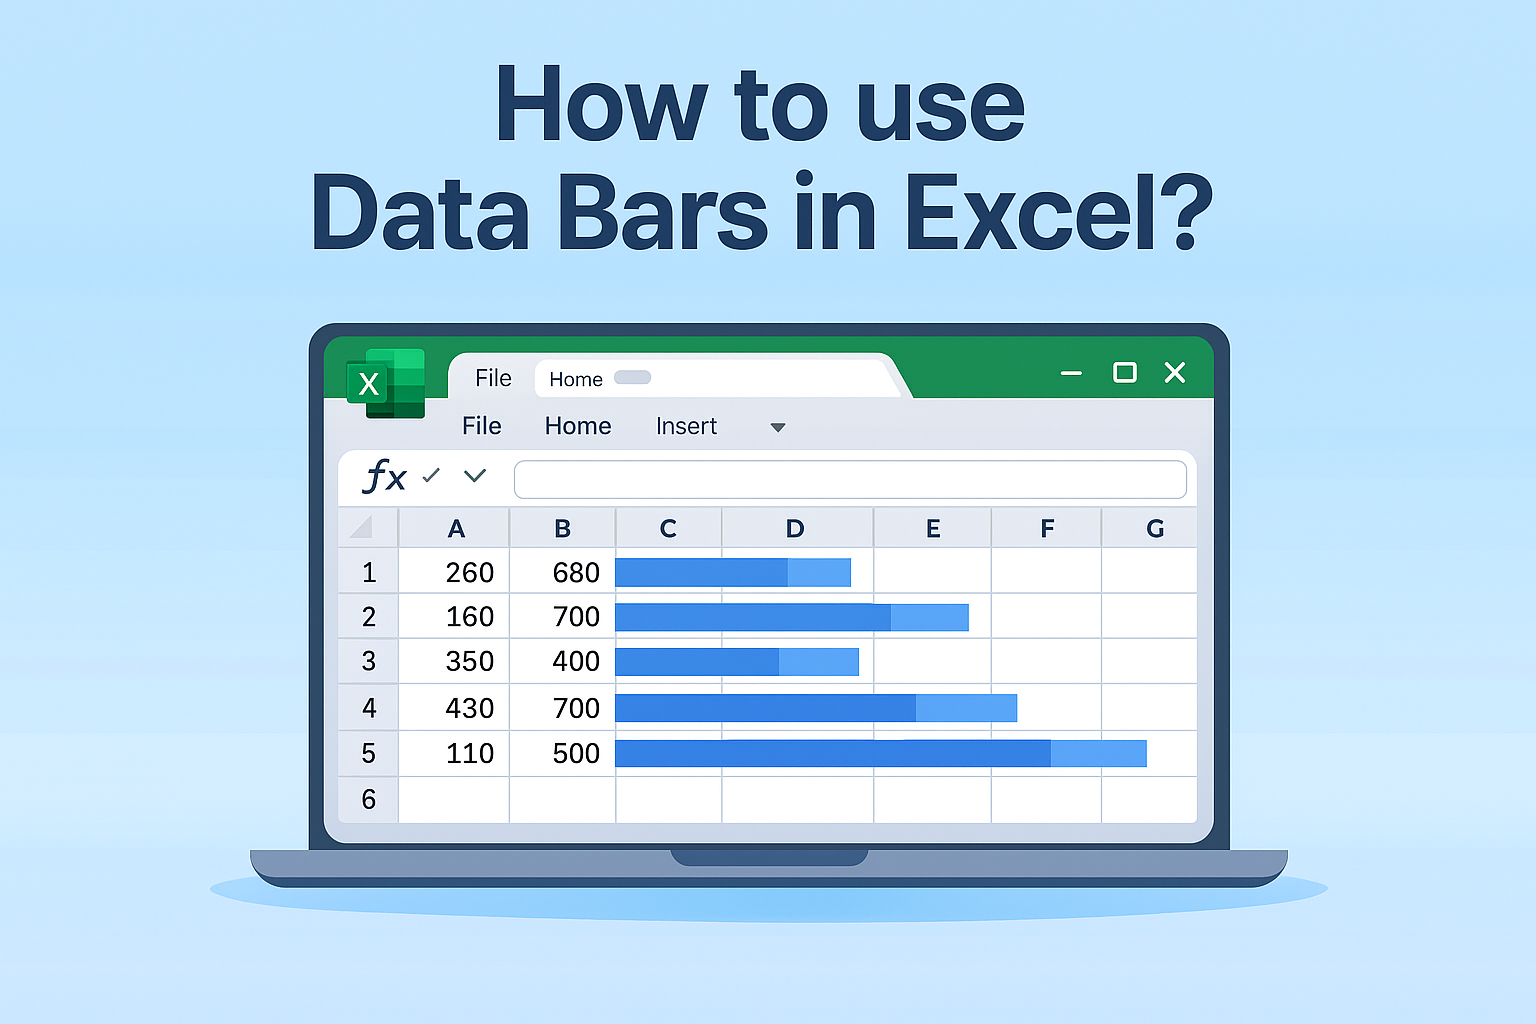
Data Bars in Excel help you easily see the size of numbers in your cells with colorful bars that fill proportionally to the value. They make it simple to compare data at a glance without using complex charts. In this blog, you will learn step-by-step how to add, customize, and remove Data Bars using Excel’s Conditional Formatting feature to make your data more visual and easier to understand.
✅ Step-by-Step: How to Apply Data Bars in Excel
Here’s how to add Data Bars to your worksheet:
1. Open Excel and Select Your Data Range
- Open your workbook and go to the worksheet where you want to apply data bars.
- Select the range of cells containing numeric values (e.g. B2:B20).
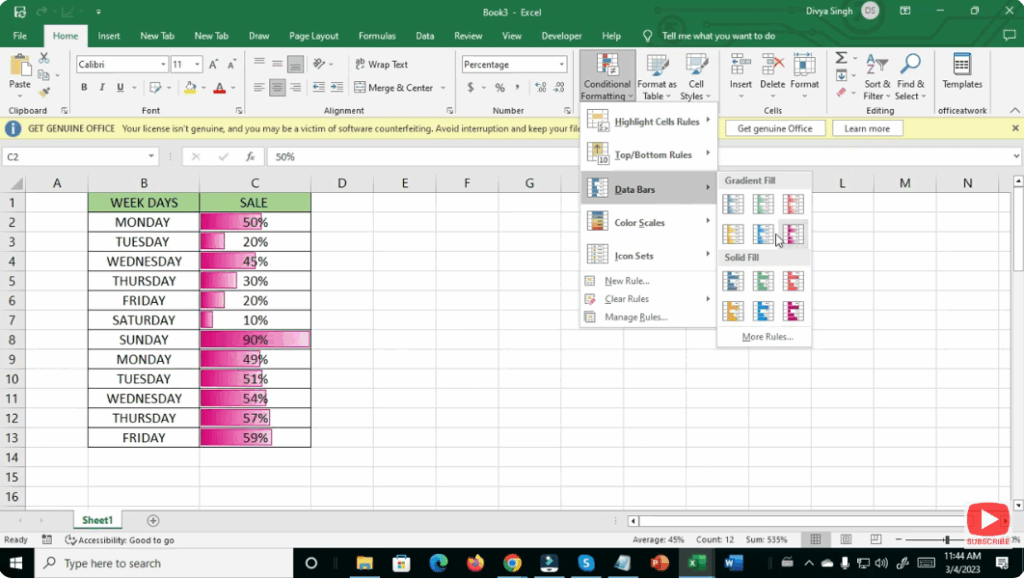
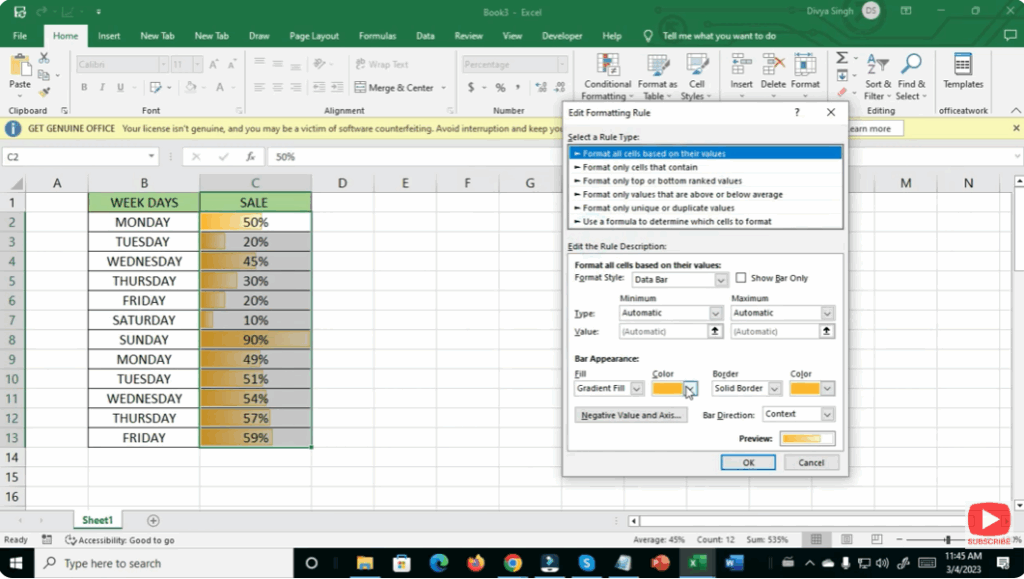
2. Open Conditional Formatting Options
- On the ribbon, go to Home → Conditional Formatting.
- Hover over Data Bars — this will open a sub-menu showing available presets (solid fill, gradient fill, different colors).
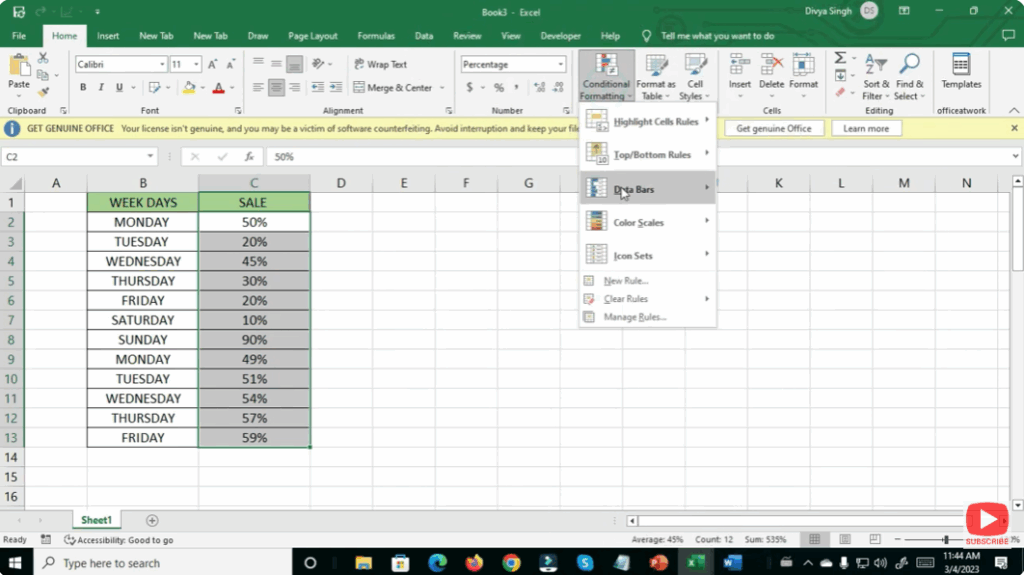
3. Choose a Data Bar Style
- Click the style you like (for example, a blue gradient, green solid fill, red gradient, etc.).
- Excel instantly applies the Data Bars — each cell shows a bar whose length matches the cell’s value relative to the min and max in that range.
4. Customize Data Bar Settings (Optional)
If you want more control over how bars are rendered:
- Go again to Conditional Formatting → Manage Rules….
- Select your Data Bar rule → click Edit Rule….
- You can adjust:
- Minimum / Maximum thresholds (e.g. 0 and 100, or automatic).
- Bar color, border.
- Whether to show the bar only, or show bar + cell value.
- “Negative values” styling (for data that can be negative).
- Click OK → Apply.
5. Use Data Bars with Mixed Data or Multiple Columns
You can apply Data Bars across multiple columns or a large data range. Excel evaluates relative values across the entire selected range — so comparisons work across all selected cells.
✅ Summary
Data Bars in Excel are an easy and visually effective way to make numeric data more intuitive. With just a few clicks — Home → Conditional Formatting → Data Bars — you can transform boring numbers into insights you can see at a glance.