
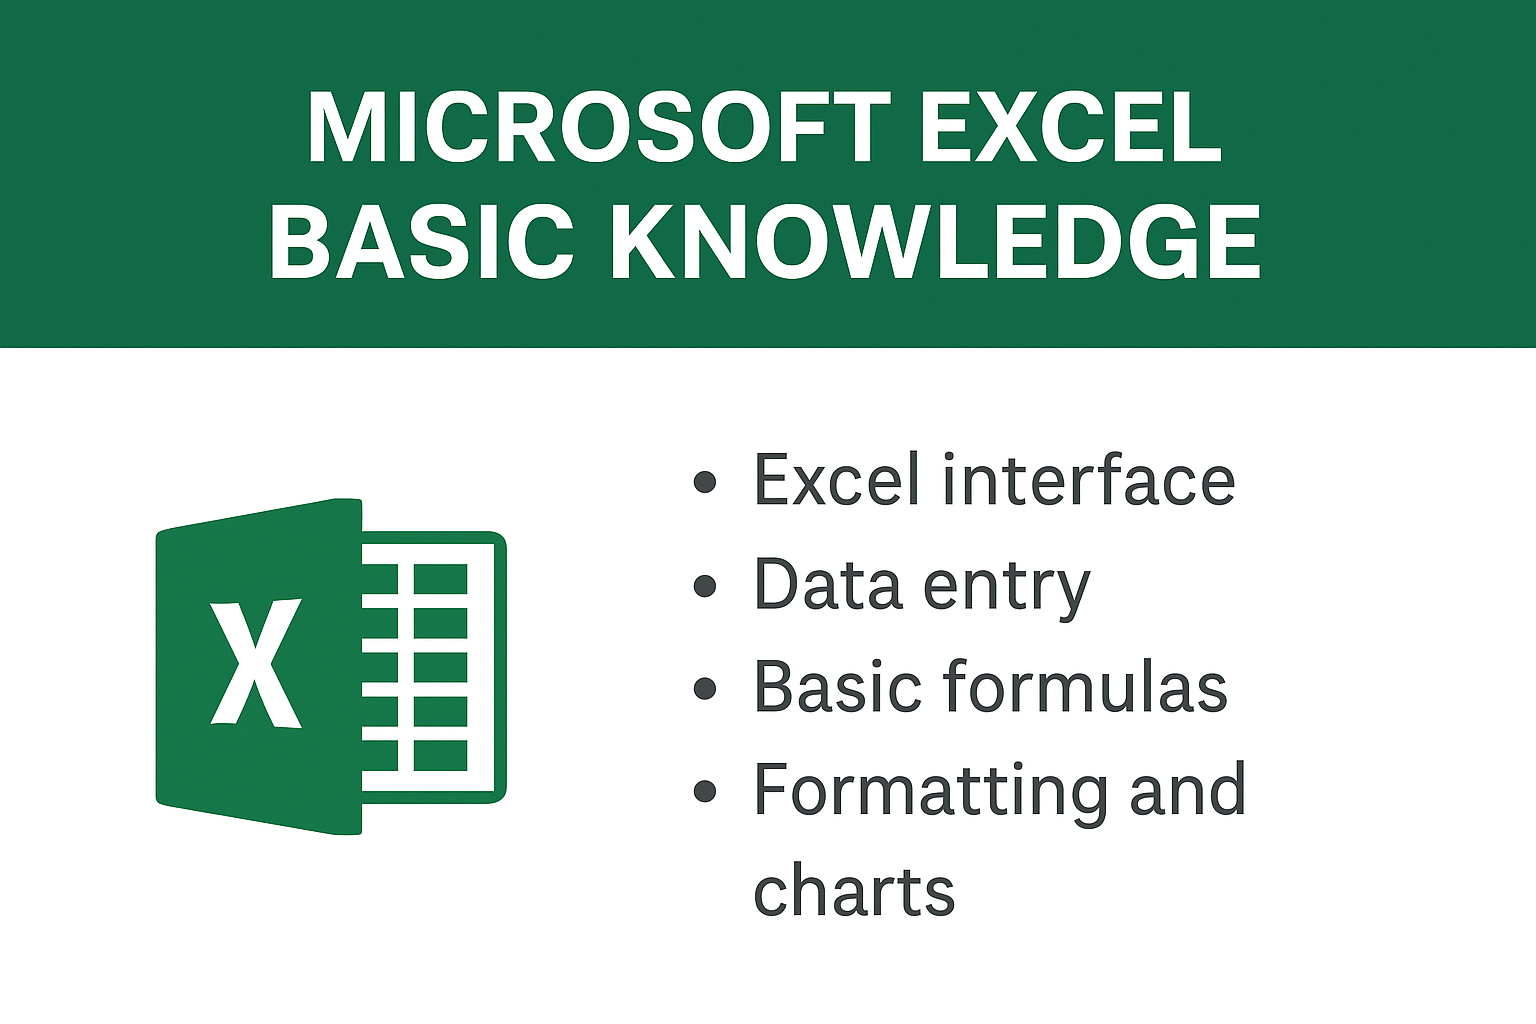
Microsoft Excel is one of the most useful tools for working with numbers, data, and lists. Whether you’re a student, office worker, or business owner, learning the basics of Excel can help you organize information, do quick calculations, and create neat tables. In this blog, we’ll explain simple Excel features like rows, columns, cells, formulas, and charts in easy language—perfect for beginners who want to get started with confidence. Let’s explore the world of Excel step by step!
Excel Interface Overview
When you open Excel, you’ll see several important parts:
| Part Name | Description |
|---|---|
| Workbook | The file that contains your Excel data. |
| Worksheet | A single sheet inside the workbook (like Sheet1, Sheet2). |
| Row | Horizontal lines labeled 1, 2, 3… |
| Column | Vertical lines labeled A, B, C… |
| Cell | The intersection of a row and column (e.g., A1, B3). |
| Ribbon | The top menu with tabs like Home, Insert, Page Layout, etc. |
Basic Data Entry in Excel
- Click any cell and start typing.
- Press Enter to move down or Tab to move right.
- Use arrow keys to move between cells.
You can type text, numbers, or formulas into cells.
Basic Excel Formulas
Excel formulas always start with an equals (=) sign.
| Task | Formula Example | Meaning |
|---|---|---|
| Addition | =A1 + B1 | Adds values in A1 and B1 |
| Subtraction | =A1 - B1 | Subtracts B1 from A1 |
| Multiplication | =A1 * B1 | Multiplies A1 and B1 |
| Division | =A1 / B1 | Divides A1 by B1 |
| Auto Sum | =SUM(A1:A5) | Adds values from A1 to A5 |
Shortcut: Select numbers → Click AutoSum (Σ) on Home tab → Press Enter.
Formatting Cells
To make data look clean and readable:
- Bold, Italic, Underline: Home → Font section.
- Change Font Size / Style: Home → Font.
- Borders: Home → Borders option.
- Cell Color: Home → Fill Color.
- Text Alignment: Home → Alignment section.
Sorting and Filtering Data
Sort Data
Home → Sort & Filter → Choose Ascending (A to Z) or Descending (Z to A).
Filter Data
- Select your data range.
- Go to Sort & Filter → Filter.
- Dropdown arrows appear to filter values.
Creating Charts
Charts help visualize data quickly.
Steps:
- Select the data range you want to convert to chart.
- Go to Insert → Choose Chart (Bar, Pie, Line, etc.).
- Excel will generate a chart instantly.